Statistics for Accountants in Excel
Statistics for Accountants in Excel looks at the various ways you can use statistics and probability to enhance your role as an accounting and finance professional.
This course will enable you to
- Understand the basics of probability in Excel
- Use statistics to summarise and describe data you�re working with
- Accurately predict the likelihood of business outcomes
- Learn how to use pivot tables, COUNTIF and HYPGEOM.DIST to count probability
- Use Excel tools to select samples, calculate confidence and estimate a population size
- Test explanations or hypotheses you come up with using Excel
About the course
As accountants, we are all familiar with Excel. However, in a dynamic and ever-changing world, we need to be smarter about how we use the tools we have at our disposal. Technology is moving forward at an incredible pace and using programmes like Excel to their full potential is vital if you want to stay relevant in this new digital era.
Using statistics and probability in Excel can help you to enhance your role as an accounting and finance professional. The techniques covered in this course can help you to understand how to use statistics to summarise and properly describe the data with which you're working.
You will cover the basics of probability, so that you can understand how to predict more accurately the likelihood of certain business outcomes. You'll also touch on the various issues you might discover and then how to test explanations or hypotheses that you come up with.
Look inside

Contents
- Descriptive statistics
- How do you get descriptive statistics in Excel?
- How do you create and understand a histogram?
- How do you create and understand a box plot?
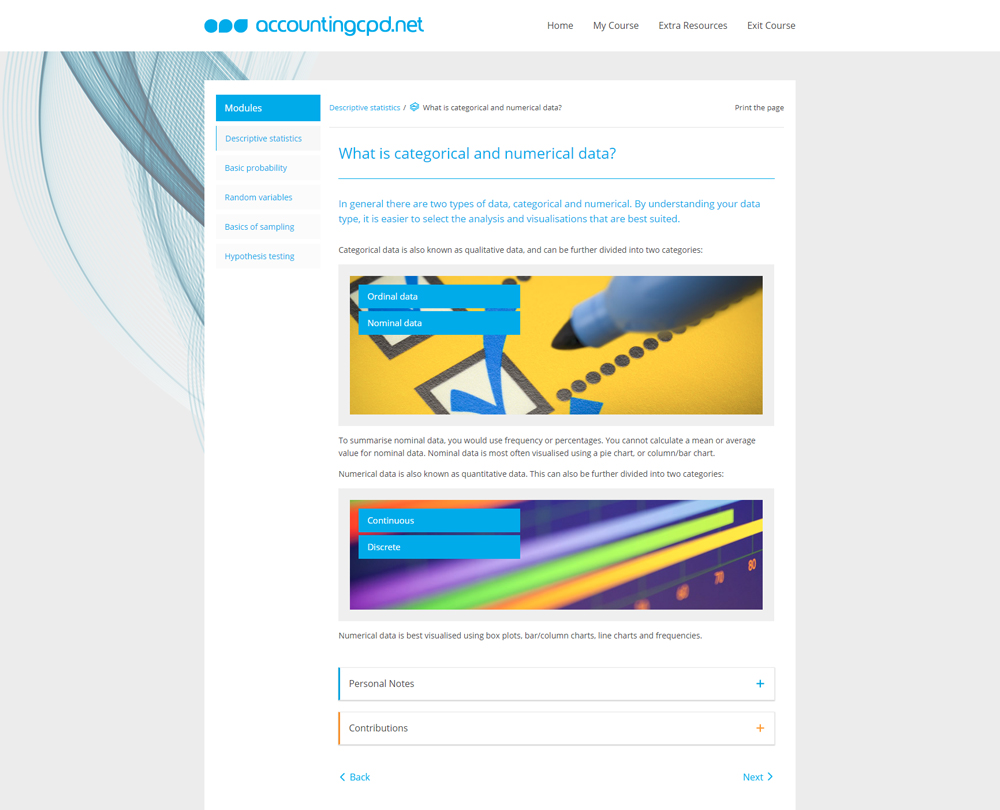
- What is categorical and numerical data?
- How do you summarise categorical data with pivot tables?
- What are some useful Excel statistics functions?
- Basic probability
- What is probability?
- What is the law of complements?
- What are mutually exclusive and independent events?
- What is conditional probability?
- What is the law of total probability?
- Random variables
- What are random variables?
- What are binomial random variables?
- What are Poisson random variables?
- What is normal distribution?
- What is the central limit theorem?
- What are z-scores?
- Basics of sampling
- What are populations and samples?
- What are confidence levels and intervals?
- How do you calculate confidence levels and intervals?
- How do you estimate a sample size using an estimated population mean?
- Hypothesis testing
- What is a hypothesis test?
- How do you carry out a z-test?
- What is a t-test?
- What is correlation and how do you calculate it?
- Can you use the Data Analysis ToolPak for hypotheses testing?
How it works
Author

Reviews
You might also like
Take a look at some of our bestselling courses