Corporate Financial Modelling: Building Forecasts and Cash Flows
Using a real life Excel example, this course takes you through a process where you can learn how to develop forecasts and perform financial analysis. It leads you through a series of steps required to create your own model.
This course will enable you to
- Understand the different forecasting methods available to you in Excel and apply them to your own data
- Use ratio analysis to produce a forecast
- Generate expectations of future performance and provide forecasted statements and cash flows
- Create a flexible model which can be used to review different scenarios, and where inputs can be quickly changed, and results quickly accessed
About the course
Financial modelling is key to every business. Financial models can inform budgeting, forecasting, investment analysis, cash flows, loan sizing, valuation � the list is endless. If your financial models aren't right, your business is going to make bad decisions.
Using a real life Excel example, this course takes you through a process where you can learn how to develop forecasts and perform financial analysis. It leads you through a series of steps required to create your own model.
Corporate Financial Modelling: Building Forecasts and Cash Flows is the second CPD course in a three-part series. Starting with, Corporate Financial Modelling: Setting up Financial Models, which set out a methodology for building models in Excel. This course helps you take a simple historic spreadsheet model and develop it by adding a financial forecast and using other forecasting techniques.
Look inside

Contents
- Forecasting
- What are the forecasting basics?
- What causes forecasting errors?
- What types of charts should we use?
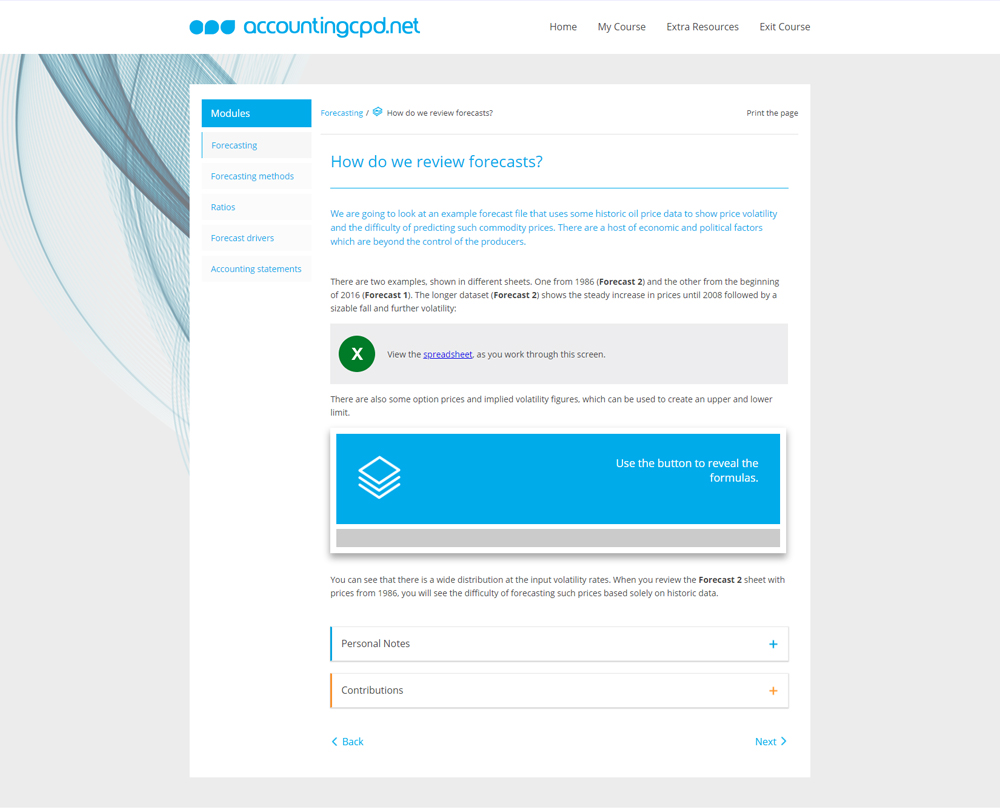
- How do we review forecasts?
- How can we appraise accuracy?
- How do we analyse data in Excel?
- Forecasting methods
- How can we identify patterns?
- What is the simple percentage plus method?
- How do we use compound annual growth rate?
- How are trends useful?
- What is smoothing?
- How do we look at seasons?
- How do we use regression?
- What is the inflation problem?
- Ratios
- What factors can affect cash flow?
- What are the core ratios?
- What are the profitability ratios?
- What ratios measure operating efficiency?
- What ratios can help with financial structure?
- Is growth sustainable?
- What are the market ratios?
- What error functions and units should be considered?
- What checks are required?
- Forecast drivers
- What assumptions can we make?
- How do we generate the income statement?
- How are balance sheet assets generated?
- What about balance sheet liabilities?
- Why are the workings sheets important?
- How do we deal with divisions?
- Accounting statements
- What is the structure of the balance sheet?
- How do we model the income statement?
- How do we model the balance sheet?
- What are the mechanics of cash flow?
- What are the cash flow ratios?
- How can we avoid common mistakes?
- How should we deal with iteration?
- What further checks are needed?
How it works
Author

Reviews
You might also like
Take a look at some of our bestselling courses